UNITED STATES
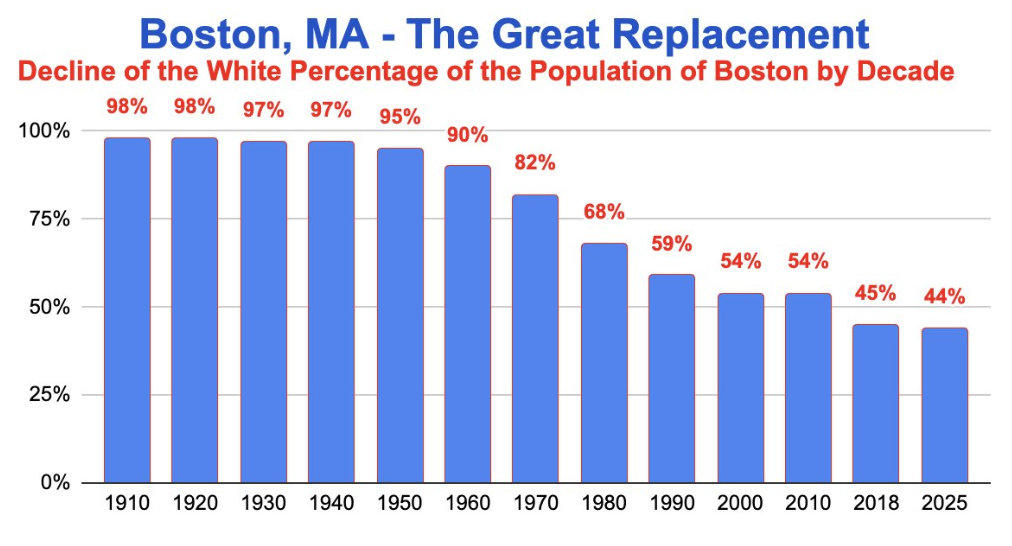
— Over the past century, Boston has undergone significant demographic changes, with the white population dropping from
99% in 1925
to
44% in 2025
, according to long-term U.S. Census data visualizations circulating online. The shift highlights broader urban demographic trends being observed in other major cities nationwide.
A chart shared online tracks the
decline in Boston’s white population by decade
, noting key drops during the
1970s through the 1990s
. By 1970, the white population in Boston had decreased to 82%. By 1990, it dropped further to 59%, and by
2018
, it stood at
45%
. The projected 2025 figure is
44%
, reflecting a slow but ongoing shift in the city’s racial makeup.
Population Changes Seen Across the U.S.
Boston’s case is part of a
larger trend seen in multiple U.S. cities
, including:
-
Montgomery, Alabama
: White population dropped from 55% in 1860 to
28% today
. -
Jackson, Mississippi
: From 62% white in 1860 to
14% today
. -
Atlanta, Georgia
: Also following a similar trajectory, according to various census comparisons.
These changes stem from multiple factors such as
urban migration
,
birth rate differences
, and
economic opportunities
drawing in diverse populations over generations.
Context for the Trend
Experts have noted that urban areas tend to become more demographically mixed over time due to
economic shifts, education access, housing patterns
, and
immigration policy changes
. The Boston data is not unique but part of a long-established trend seen in many major metro areas, including
Chicago, Los Angeles, and Houston
.
The term
“The Great Replacement,”
sometimes used in online commentary, is not a term recognized by demographic researchers or federal institutions. It’s important to understand these shifts through factual, policy-neutral data sources like the
U.S. Census Bureau
, which routinely tracks racial and ethnic composition across decades.
How has your city changed over the decades? Share your experience at
SaludaStandard-Sentinel.com